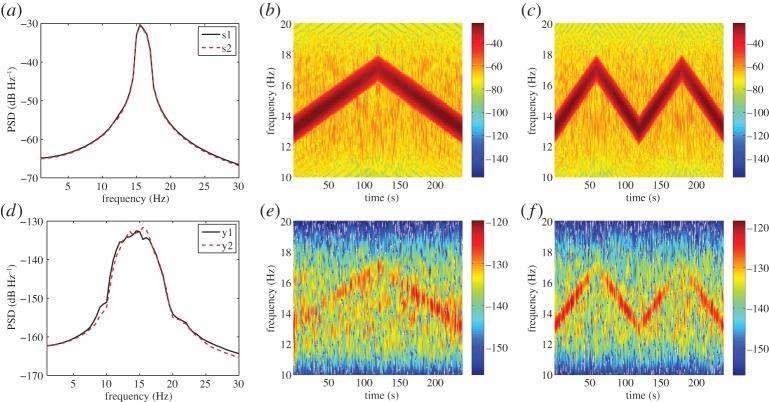
Figure 6.
PSD and time–frequency spectrogram of SSVEP stimuli and brain responses. (a) PSD of SSVEP stimuli presented to subjects 1 and 2 (s1 and s2). (b) Time–frequency spectrogram of s1. (c) Time–frequency spectrogram of s2. (d) PSD of SSVEP responses of subjects 1 and 2 (y1 and y2). (e) Time–frequency spectrogram of y1. ( f) Time–frequency spectrogram of y2. (Online version in colour.)

