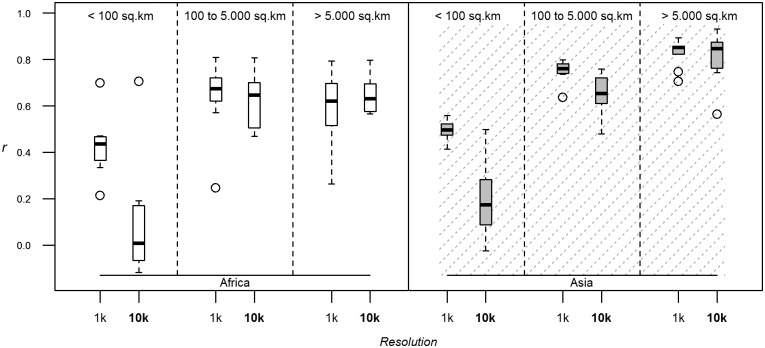
Fig 2. Number of bootstraps.
Correlation coefficients between log-transformed observed and predicted densities evaluated through downscaling, using the stratified regression modelling method, density as dependent variable, the full set of predictor variables, the 1 km resolution models, and varying the number of bootstraps. The correlation coefficient is estimated by breaking down evaluation polygons by their size, and for both species and continents.

