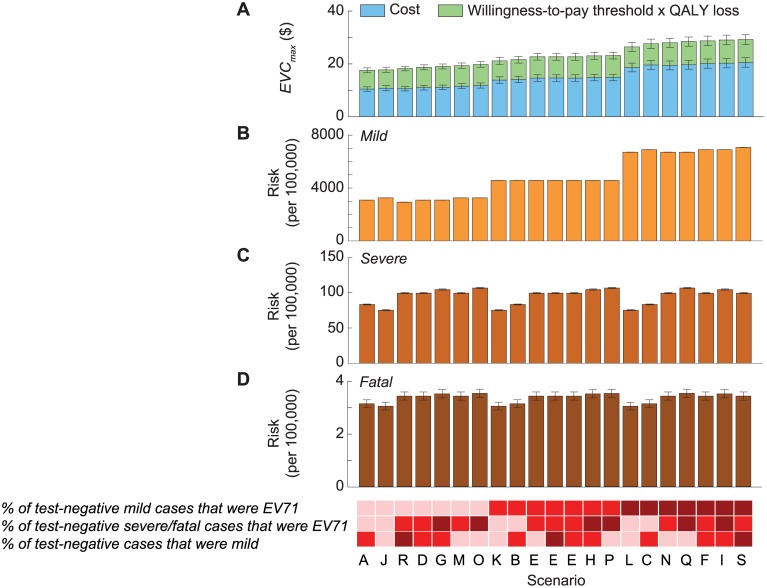
Fig 4. Cost-effectiveness of routine pediatric EV71 vaccination in China with a willingness-to-pay threshold of one times GDPpc.
The 21 scenarios from Fig 2 are listed along the x-axis in ascending order of EVCmax. The base case was scenario A, which had the lowest EVCmax. The color shades at the bottom indicate the assumptions regarding the percentage of test-negative cases that were mild during 2010–2012 (bottom row), the percentage of test-negative severe/fatal cases that were EV71-HFMD (middle row), and the percentage of test-negative mild cases that were EV71-HFMD (top row) in each scenario, where darker shades correspond to higher percentages. As described in Fig 2B, three combinations of these percentages resulted in the same scenario, namely scenario E. The size of the 95% prediction intervals was driven by the parametric uncertainty associated with our estimates of the risk of EV71-HFMD and the mean cost and QALY loss attributed to EV71-HFMD in our probability sensitivity analysis (as in Fig 2B). (A) Pediatric EV71 vaccination would be cost-saving and cost-effective if EVC was below the cost of EV71-HFMD (blue bars) and EVCmax (blue plus green bars), respectively. (B–D) The risk of mild, severe, and fatal EV71-HFMD in each scenario. The error bars show the 95% CIs, but in some cases they are not apparent for the risk of mild and severe EV71-HFMD.

