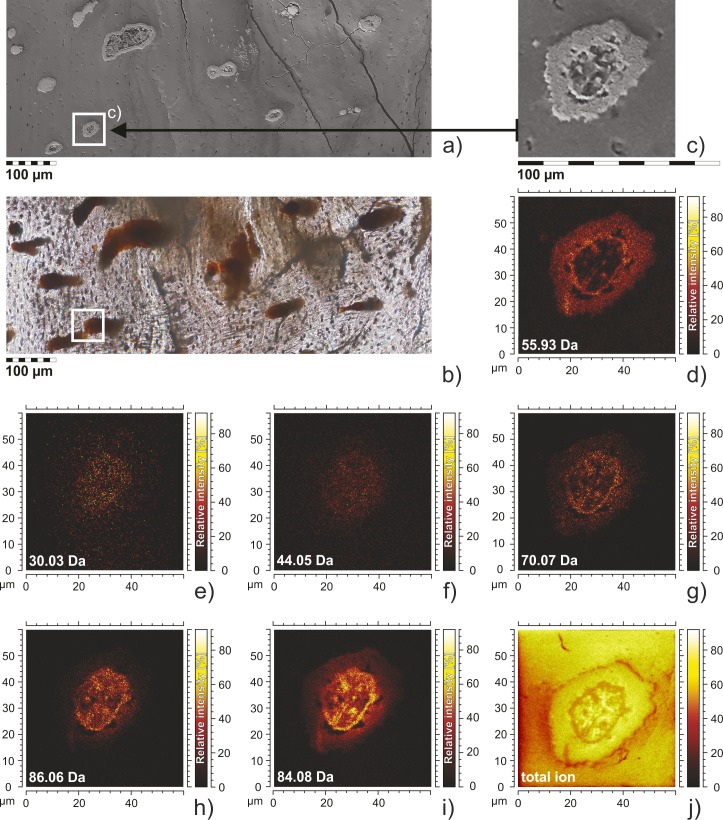
Fig 3. The structure and molecular composition of the fossilized blood vessel sections of SUT-MG/F/Tvert/2.
ESEM images and ToF-SIMS fast imaging mode mapping of blood vessels sections displaying their tubular structure. a) ESEM image of thin section showing fossilized blood vessels; analyzed area marked by rectangle. b) the same thin section in optical microscopy; analyzed area marked. c) blood vessel in SEM image, enlarged part of Fig 3a shows location of ToF-SIMS mapping; d‒j) ToF-SIMS ion distribution maps generated for the selected masses corresponding to iron (55.86 Da) and amino acid ions: 30.03 Da–CH4N+ (glycine or proline), 44.05 Da–C2H6N+ (alanine), 70.07 Da–C4H8N+ (proline), 86.06 Da–C4H8NO+ (hydroxyproline), 84.08 Da–C5H10N+ (lysine) and total ion image (Fig 3j) in positive polarity. The distribution of iron (Fig 3d) within the vessel section overlaps with the distribution of ions.

