
Fig 2. Result of the application of QUINT on posttest-to-follow-up difference in parent-rated ADHD symptoms (DBD; Disruptive Behavior Disorder rating scale parent version).
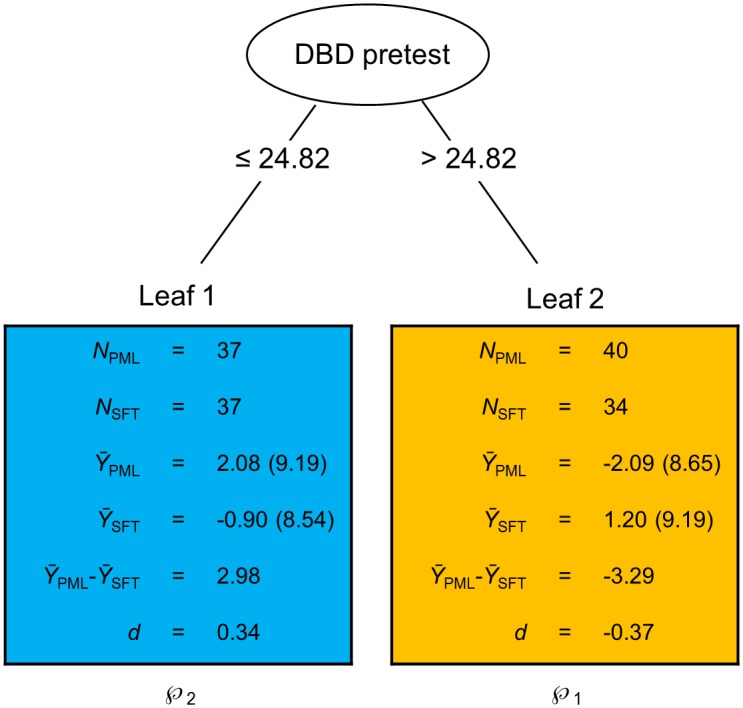
Smaller outcome values are preferred as these refer to more reduction of parent-rated ADHD symptoms. The ellipsis in the figure represents the root node, which corresponds to the complete group of clients. This ellipsis contains the split variable, with below it the corresponding split point. The rectangles represent the leaves of the tree, that is, the final subgroups of adolescents; each rectangle contains the sample size of the corresponding subgroup, the outcome means (and standard deviations) for the plan my life and solution-focused treatment conditions (ȲPML and ȲSFT), the uncorrected difference in means (ȲPML−ȲSFT), and the uncorrected corresponding effect size d. Assignment of the leaves to the partition classes is represented by ℘1 and ℘2.