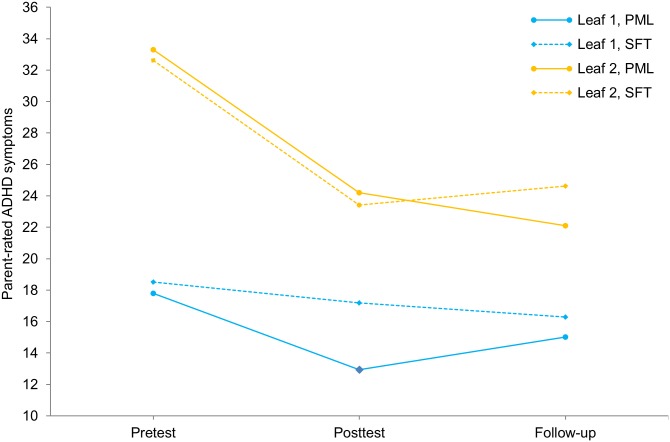
Fig 3. Change in parent-rated ADHD symptoms (DBD) from pretest to follow-up up for the two subgroups resulting from the application of QUINT on posttest-to-follow-up difference in parent-rated ADHD symptoms.The y-axis represents the raw scores on parent-rated ADHD symptoms.
Leaf 1 is represented in blue, and Leaf 2 in orange. The plan my life (PML) and solution-focused treatment (SFT) groups within each leaf are represented by solid lines and dashed lines, respectively.

