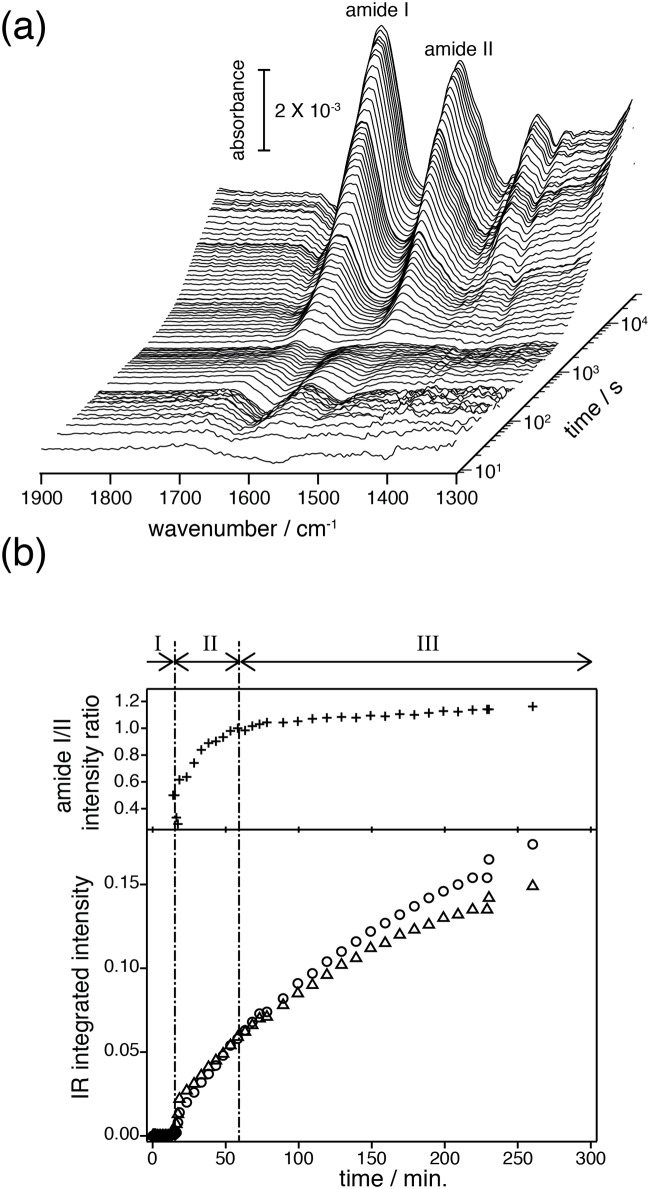
Fig 2. Overview on the time-resolved SEIRAS spectra and their kinetics.
(a) Membrane protein folding into the solid-supported nanodiscs observed as spectral evolution after triggering the transcriptional/translational process. (b) Integrated intensities of amide I (○) and II (△) bands (lower) and the intensity ratio of amide I / amide II (upper) are plotted against the reaction time. Roman numbers above the upper part of the plot refer to the I) Pre-conditioning period prior to protein insertion, II) Membrane insertion of the polypeptide chain and formation of secondary structure, and III) Formation of tertiary structure.

