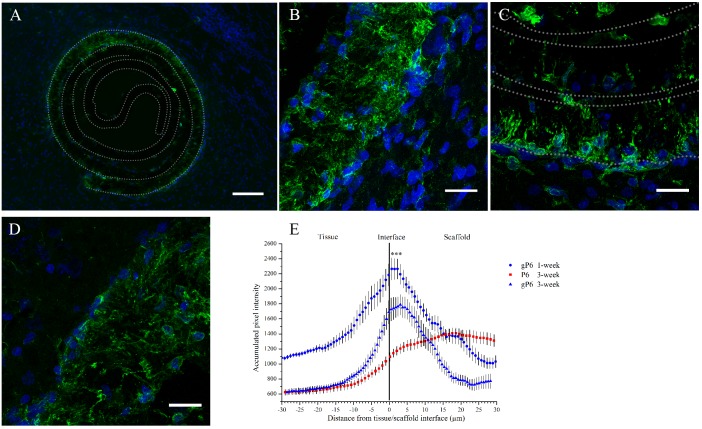
Fig 2. Microglial response to graphene-free or—inclusive PCL scaffold implantation at Week 1 and Week 3.
(A) Image shows an overview of microglial infiltration into the outer shell of a gP6 scaffold at Week 3, and gP6 at high magnification at (B) Week 1 and (C) Week 3. (D) Graphene-free P6 scaffold at Week 3 (Green: Iba1+ microglia cells, blue: DAPI stained nucleus). (E) Microglial profile across the tissue/scaffold interfaces (*** p<0.001, n = 4). All brain tissue sections were collected on the transverse plane. Scale bar for (A) represents 100 μm; Scale bar for (B, C and D) represents 20 μm. Error bar in (E) shows standard error of the mean.

