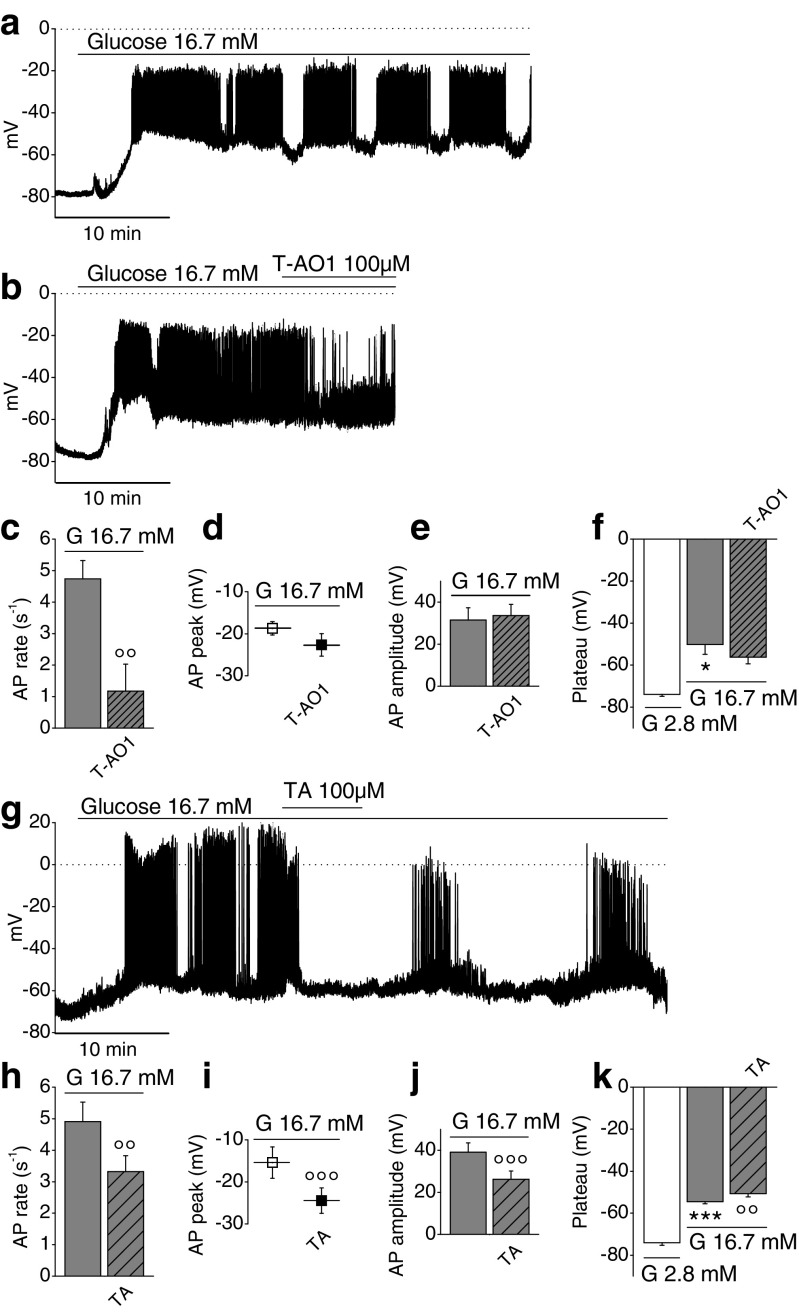
Fig. 3.
Effect of Ano1 inhibitors on the membrane potential of β-cell from whole mice islet stimulated with 16.7 mM glucose. a, b, g Representative zero-current nystatin-perforated patch-clamp voltage recordings. Sampling rate, 18 kHz; 2-kHz filter setting. Dotted lines represent zero-voltage level. a Glucose-stimulated cell (16.7 mM glucose). b Glucose-stimulated cell ± 100 μM T-AO1 in the bathing medium. c Effect of T-AO1 (n = 3) on action potential (AP) rate, in presence of glucose. d Effect of T-AO1 (n = 3) on AP peak, in presence of glucose. e Effect of T-AO1 (n = 3) on AP amplitude, in presence of glucose. f Effect of T-AO1 (n = 3) on the membrane plateau potential during active phase in presence of glucose. g Glucose-stimulated cell ± 100 μM TA in the bathing medium. h Effect of TA (n = 7) on action potential rate, in presence of glucose. i Effect of TA (n = 9) on AP peak, in presence of glucose. j Effect of TA (n = 9) on AP amplitude, in presence of glucose. k Effect of TA (n = 9) on the membrane plateau potential during active phase, in presence of glucose. The experiments were performed on ten preparations of mice islets. Friedman test on f, P = 0.05; repeated measures ANOVA test on k, P = 6.88 × 10⁻¹⁰. *P < 0.05, ***P < 0.001 vs. 2.8-mM glucose condition; °°P < 0.01, °°°P < 0.001 vs. 16.7-mM glucose condition (paired Student’s t tests in c–e, h–j; Wilcoxon type tests with Dunn–Bonferroni correction in f; least significant difference tests in k)

