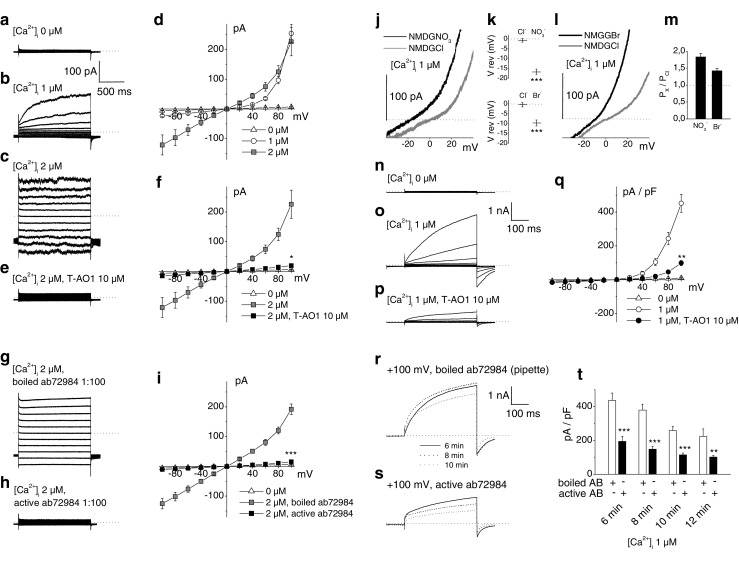
Fig. 5.

Chloride currents from rat β-cells (inside-out excised macropatches and whole cell). a–i Chloride currents from inside-out single excised patches. Pipette and bath solutions contained 150 mM NMDG-Cl. Sampling rate, 25 kHz; 2-kHz filter setting. Filled pipette resistance, 5 MΩ. Current traces recorded were induced by 1500-ms voltage steps from −100 to +100 mV, spaced 20 mV (holding potential, −70 mV, 200 ms before and after each step). Dotted lines indicate zero-current level. a–c Representative recordings of Cl− currents. The cytosolic face was exposed to bath solutions with different [Ca2+]: 0 μM in a, 1 μM in b, and 2 μM in c. d Steady-state current–voltage relationships of Cl− currents at 0 μM Ca2+ (n = 12), 1 μM Ca2+ (n = 5), and 2 μM Ca2+ (n = 8). e Representative recording of Cl− currents stimulated by 2 μM Ca2+ in the presence of T-AO1 10 μM in the pipette. f Steady-state current–voltage relationships of Cl− currents at 2 μM Ca2+ in the absence (n = 8) or presence (n = 12) of T-AO1 10 μM in the pipette and at 0 μM Ca2+ (n = 12). g, h Representative recordings of Cl− currents stimulated by 2 μM Ca2+, respectively, in the presence of boiled or active blocking Ano1 antibodies ab72984 1:100 in the pipette. i Steady-state current–voltage relationships of Cl− currents at 2 μM Ca2+ in the presence of boiled (n = 18) or active (n = 13) blocking Ano1 antibodies ab72984 1:100 in the pipette and at 0 μM Ca2+ (n = 12). j–t Whole-cell Cl− currents from dispersed β-cells. Pipette and bath solutions contained 150 mM NMDG-Cl except in anion selectivity experiments where the bath Cl− was replaced by NO3 − or Br− for repeated measures. Sampling rate, 10 or 25 kHz; 2-kHz filter setting. Filled pipette resistance, 5 MΩ. Dotted lines indicate zero current or Px/PCl = 1 level. j, l Representative current traces from β-cells induced by voltage ramps (20 mV/s) at 1 μM Ca2+ (pipette). Bath NMDG-Cl solution was replaced by either NMDG-NO3 in j or NMDG-Br in l. k Nitrate and bromide anions shift the reversal potential (V rev) toward negative values (n = 11 and 9, respectively). m Permeability ratios (Px/PCl) of nitrate and bromide anions calculated from the shifts of the reversal potentials in k using Goldman, Hodgkin, and Katz equation. n–t Current traces recorded were induced by 400-ms voltage steps from −100 to +100 mV, spaced 20 mV (holding potential, −70 mV, 100 ms before and after each step). n–p Representative recordings of whole-cell Cl− currents at 0 μM Ca2+ in n, 1 μM in o, and 1 μM in the presence of T-AO1 10 μM in the bath medium in p. q Normalized current–voltage relationships of whole-cell Cl− currents at 1 μM Ca2+ in the absence (n = 21) or presence (n = 15) of T-AO1 10 μM in the bath medium and at 0 μM Ca2+ (n = 14). r, s Representative recordings of whole-cell Cl− currents evoked by 1 μM Ca2+ at +100 mV after 6-, 8-, and 10-min membrane rupture in the presence of boiled Ano1 antibodies ab72984 1:100 in the pipette (r) or active Ano1 antibodies ab72984 1:100 in the pipette (s). t Normalized whole-cell Cl− currents evoked by 1 μM Ca2+ at the end of the +100-mV voltage step in the presence of boiled Ano1 antibodies ab72984 1:100 or active Ano1 antibodies ab72984 1:100 in the pipette after 6 min (n = 14 and 13), 8 min (n = 12 and 12), 10 min (n = 10 and 10), and 12 min (n = 5 and 8) membrane rupture. Experiments of Fig. 5 were carried out on six preparations of rat dispersed islet cells. Kruskal–Wallis tests on f, i, q, P < 0.001, *P < 0.05, **P < 0.01, ***P < 0.001 vs. control (Mann–Whitney-type tests with Dunn–Bonferroni correction in f, i, q, paired Student’s t tests in k, independent Student’s t tests in t)
