Fig 3.

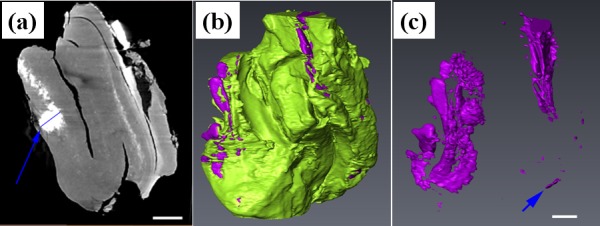
The microCT coronal image (a), 3D reconstruction result (b) and segmented micro-calcifications and spots with metallic density (c) of No. 3 specimen. The scale bar shown in (a) and (c) is 500 microns.

The microCT coronal image (a), 3D reconstruction result (b) and segmented micro-calcifications and spots with metallic density (c) of No. 3 specimen. The scale bar shown in (a) and (c) is 500 microns.