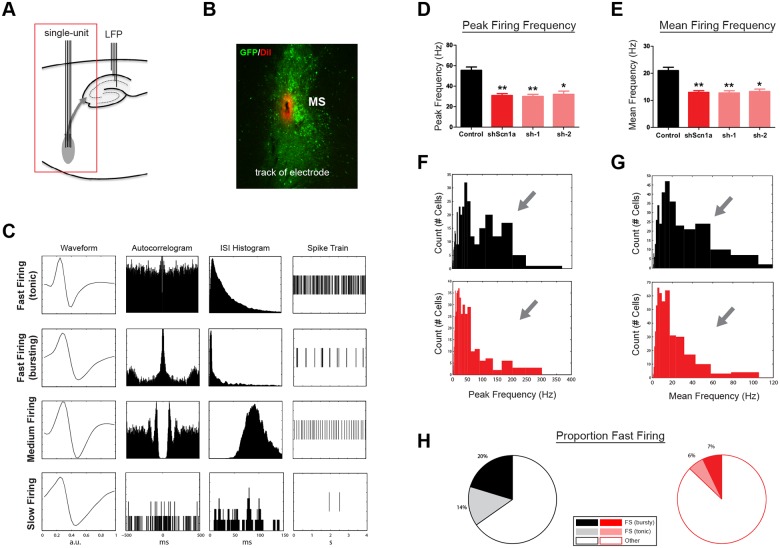
Fig 3. Reduction in fast- and burst-firing neurons after MSDB knockdown of Nav1.1.
(A) Schematic of electrode recording sites. Single-units were recorded after lentiviral injections in the MSDB. (B) Example of electrode track (DiI) located in the MSDB injection site (GFP). (C) Examples of single-units recorded in the MSDB. Each row represents one unit, and each column shows a different type of plot for that unit (average waveform, autocorrelogram, inter-spike-interval histogram, and example of spike train). Multiple firing types were observed, including fast-firing (rhythmic bursting and tonic), medium-firing, and slow-firing. (D,E) Average peak and mean firing frequency for all units recorded in control or shScn1a groups (‘shScn1a’ refers to sh-1 & sh-2 pooled data). Bars represent mean +/- SEM. *p<.05, **p<.01. (F,G) Histograms of peak and mean firing frequency for all units (controls, black; shScn1a, red). Units with high peak frequencies were markedly reduced in shScn1a rats. (H) The proportion of units with fast- and burst-firing characteristics was also significantly lower (p<.01).

