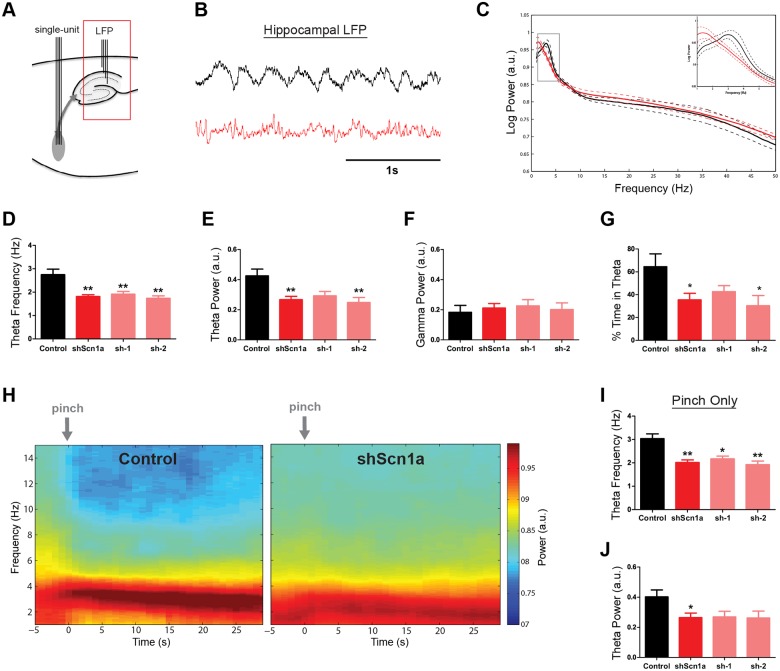
Fig 4. Suppression of hippocampal theta rhythm after MSDB Nav1.1 knockdown.
(A) Schematic of recording site. (B) Example of LFP signal from the dorsal hippocampus of a control (black) and shScn1a (red) rat. (C) Group averaged power spectra for control and shScn1a rats. Inset shows power in the theta band. Solid line indicates mean, dashed line indicates SEM. (D-F) Theta frequency and theta power were significantly reduced in shScn1a rats, but no change in high frequencies in the gamma band were observed. (G) shScn1a rats also spent less time in theta. (H) Group averaged time-frequency spectrograms for 30s of LFP data time-locked to tail-pinch events. Notice that a prominent theta rhythm is apparent in response to the tail pinch but occurs at a lower frequency in shScn1a rats. (I,J) Quantification of theta frequency and theta power for data in panel H. Bars represent mean +/- SEM. *p<.05, **p<.01.

