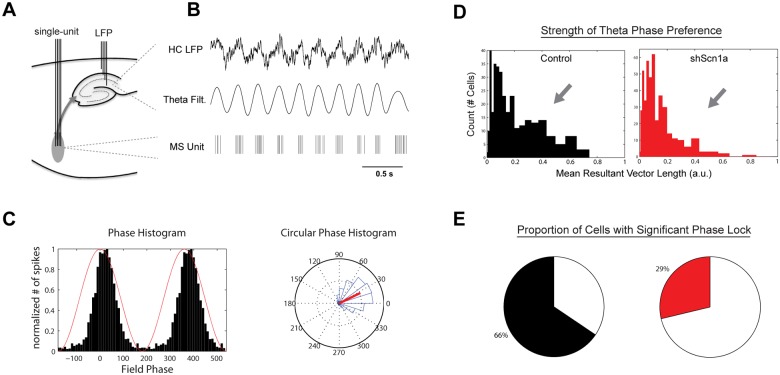
Fig 5. Reduced phase-locking of MSDB units to hippocampal theta rhythm.
(A,B) Example of hippocampal LFP and theta-filtered signal with the simultaneously-recorded spike train from one MSDB unit. Notice the alignment (phase-locking) of spikes near the peak of the hippocampal theta oscillation. (C) Example of phase histogram of spikes in a standard (left) and rose plot (right) showing a strong theta phase preference. In left plot, red line indicates phase of hippocampal theta, and black bars indicate the phase of spikes. In right plot, phase histogram is shown in blue, theta phase as coordinates on the rose plot, and the red line indicates the mean resultant vector. (D) Histograms of theta phase-locking strength (mean resultant vector length) for units from controls and shScn1a rats. Phase-locking strength and (E) the proportion of units with statistically-significant phase-locking (Rayleigh test) were reduced after knockdown of Nav1.1 (p<.01).

