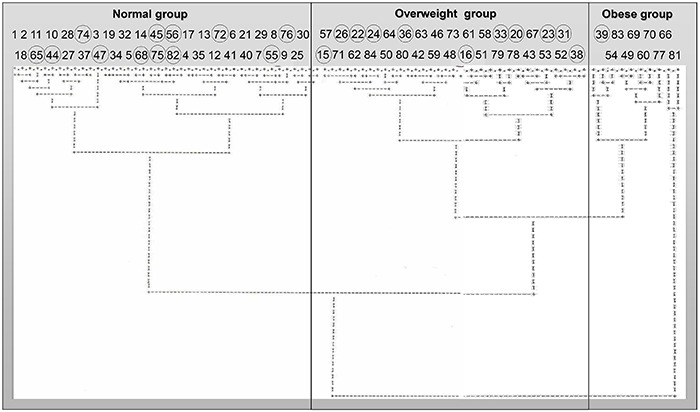
Figure 1. . Dendrogram of cluster analysis according to the adiposity index of control, overweight, and obese rats. Normal: animals from 1 to 41 that were fed a standard diet; overweight and obese: animals from 42 to 84 that received a high-fat diet. Animals represented by a circle were excluded from the study.

