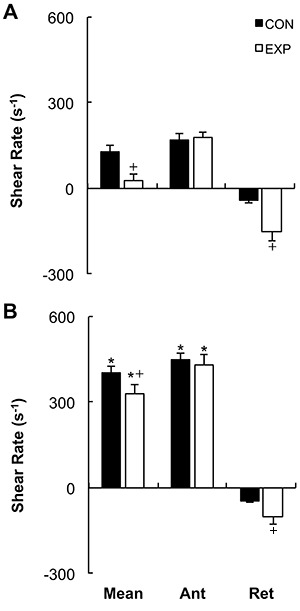
Figure 3. Shear rate profiles at rest and during handgrip exercise for control (CON) and experimental (EXP) arms. A, Rest, with the cuff inflated to 80 mmHg in the EXP arm. B, During exercise, with the cuff inflated to 80 mmHg in the EXP arm. Data are reported as mean±SE. Ant: antegrade, Ret: retrograde. *P≤0.01 compared to the same arm at rest; +P≤0.01 compared to the CON arm at the same time point (2×3 repeated-measures ANOVA test).

