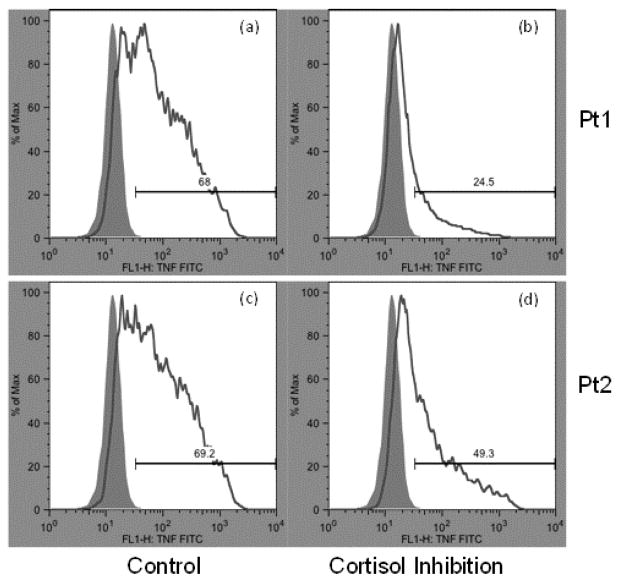
Figure 1. Examples of flow cytometry outputs measuring % TNF+ monocytes from human blood after ex vivo stimulation with LPS with and without cortisol treatment (1 μM).
Monocyte frequency on the Y axes is shown against fluorescence intensity of FITC-conjugated intracellular TNF antibody on the X axes. Solid gray (purple in the web version) areas indicate unstimulated control samples (without LPS), while white areas under the line indicate LPS-stimulated samples. Baseline fluorescence for TNF/FITC was determined and used to gate and differentiate between TNF+ and TNF− monocytes. The difference in percentage of TNF+ monocytes between LPS and control samples is calculated and termed % TNF+ monocytes. This value for each participant is shown above each bar (e.g. 68% for histogram (a) and 24.5% for histogram (b)). Histograms (a) and (b) are from one participant (Pt1) that show treatment without and with cortisol, respectively. Histograms (c) and (d) are from another participant (Pt2). The histograms (b) vs. (d) showcase the differing degree of cortisol-induced inhibition of TNF production indicative of impaired cortisol-mediated inflammation regulation (CoMIR) for Pt2.

