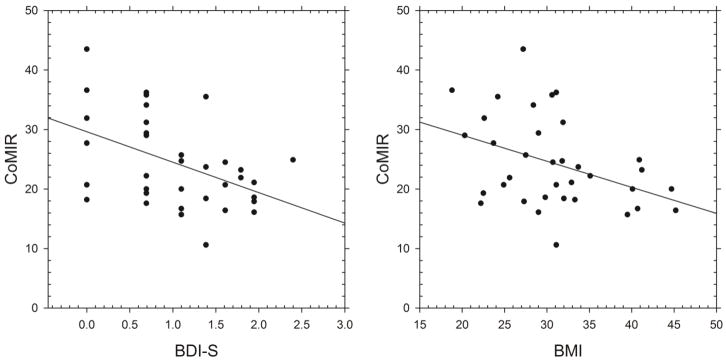
Figure 3. Scatter plots of CoMIR with BMI and BDI-S.
Scatter plots show that cortisol-mediated inflammation regulation (CoMIR) values, calculated by Δ %mono TNF, were negatively associated with obesity, indicated by body mass index (BMI) (r= −.396, p= .018), and depressive mood, assessed by Beck Depression Inventory-Somatic subscale (BDI-S) (r= −.461, p= .005). These associations indicate that individuals with greater depressive mood or obesity are more likely to exhibit smaller CoMIR values which indicate decreased responsivity to GC in suppressing inflammation.

