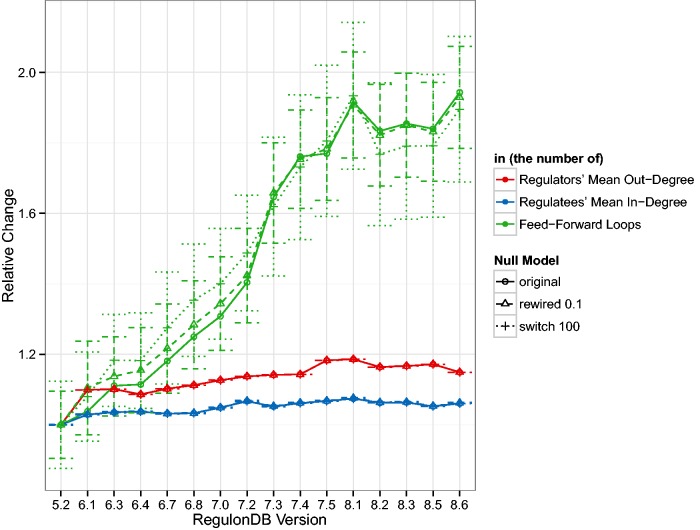
Figure 2.
The curves represent the mean out-degree of regulating nodes, i.e. those with , the mean in-degree of regulated nodes, that is, those with , and the number of three-node feed-forward loops in the GRN normalized by the values for version 5.2. As reference values, we also show the mean and standard deviation of 1000 examples where 10% of the GRN links were rewired and 1000 examples where the GRN was switch-randomized. As expected the mean degree does not vary much, or at all, in the random networks but it is surprising that the mean relative number of feed-forward loops is so close to the original. The standard deviation denotes a fairly constant range of approximately 0.15–0.2 relative units. Despite a marked increase in the number of TFs over the years, and consequently an increase in both, the number of links and the number of source (TF) and target (gene) nodes (see Figure 1), remains fairly stable over the years. There is about a increase in the which indicates that slightly more links have been added than new nodes introduced. Feed-forward loops have super-linear combinatorics, so their rapid increase due to an increasing number of links is not surprising but may indicate that more complicated dynamics may be present in the transcriptional regulatory system than previously considered. We were unable to identify any three-node feedback loops in any release, however.

