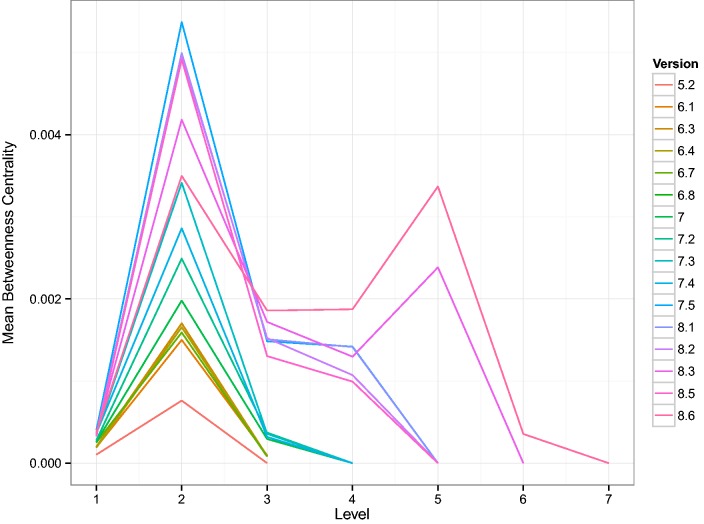
Figure 7.
Shown are curves, one for each version of RegulonDB, of the average betweenness centrality of the layers in the TF-hierarchy. Here, 1 is the bottom most layer. The hierarchy was constructed as described in (32). In that study, E. coli was reported to have four layers. Here we see an increase in the number of layers as a function of the version and the emergence of a second layer with high average betweenness centrality. This suggests a major discovery of change in the organization of TF–TF regulation.

