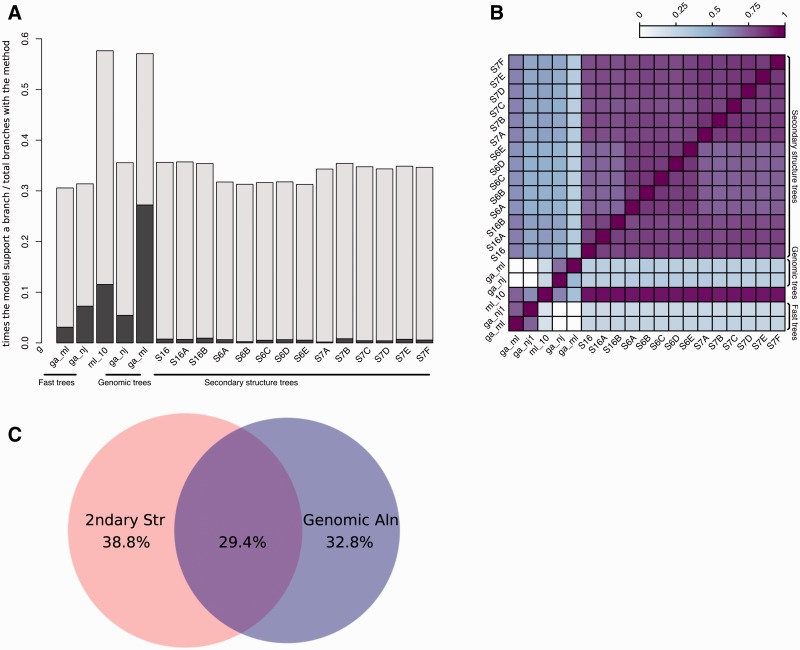
Figure 5.
Analysis of tree reconciliation. (A) Intermediate tree support for each branch in the final tree. For each final branch in the final gene trees, the number of times a given intermediate tree supports a branch is calculated and divided by the total times that tree appears. The dark regions of each bar indicate the fraction of times the branch is supported only by that tree. (B) Heatmap representing the overlap between model support. The support for each model in all final branches in the final trees is divided by the union of models supporting them, i.e. when two models support the same final branches, this ratio is 1 and when no overlap is found, this ratio is 0. (C) Venn diagram showing the overlap between branches supported by trees based on secondary structure or genomic sequences. Fast trees are included in the corresponding category.

