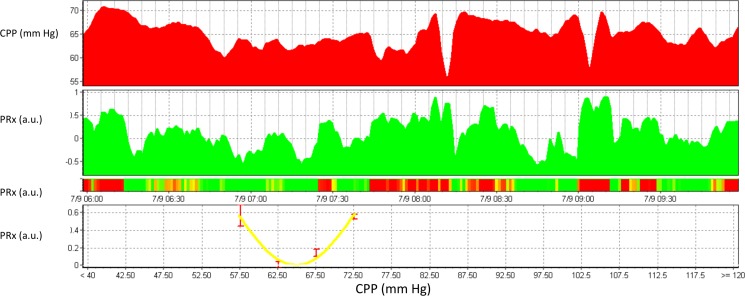
Fig 2. Example of a 4 hour epoch of multimodality monitoring signals in pediatric TBI.
In this screenshot, CPP is shown in the top panel and the pressure reactivity index in the second panel over a 4 hour period from 06:00 to 10:00. In the third panel is a risk chart whereby a negative PRx (good autoregulation) is denoted by a grey colour, and a disturbed PRx (>0.3) is denoted in black. In two instances, CPP drops below 60 mm Hg. During these drops in CPP, PRx is deranged (black on the risk chart). On the bottom panel, CPP is plotted against PRx and a polynomial curve is fitted. The minimum of this curve is around 65 mm Hg, which would therefore indicate the optimal CPP at time point 10:00.

