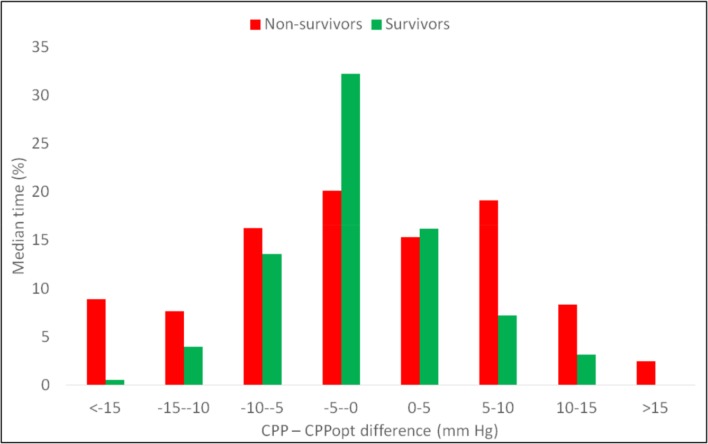
Fig 5. Time spent at different distances from CPPopt in non survivors (light grey) and survivors (dark grey).
In those that survived the distribution of time spent across the various CPP-CPPopt (ΔCPP) ranges approximated a normal distribution. Most time was spent in the range between -10 and positive 10 mm Hg, while only a small proportion of time was spent less than -10 mm Hg or greater than 10 mm Hg from CPPopt. In non-survivors (light grey), more time is spent in the extreme CPP–CPPopt (ΔCPP) ranges. This is reflected in Table 2, those who did not survive spent significantly more time with their with their CPP more than 10 mm Hg below CPPopt (Mann-Whitney p = 0.04) and less time with their CPP within 10 mm Hg of the CPPopt (Mann-Whitney U test p = 0.02).

