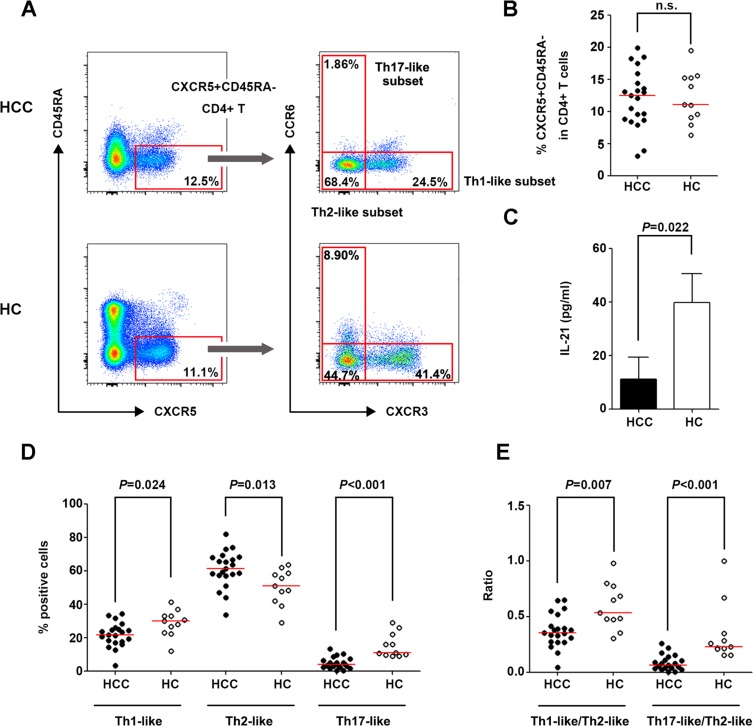
Figure 1. Circulating Tfh cells and cell subsets in patients with HCC and HC.
(A) Gating strategies of circulating Tfh cells and their subsets in HCC and HC. (B) Percentage of CXCR5+CD45RA−cells in CD4+ lymphocytes in HCC (n = 21) and HC (n = 11). (C) IL-21 concentration in the co-culture supernatant of purified CXCR5+CD45RA−CD4+CD3+ and IgD+CD27−CD19+CD3− cells. (D) Distribution of Th1-like, Th2-like, and Th17-like subsets in circulating Tfh cells in HCC and HC. (D) Ratio of Th1-/Th2-like Tfh subsets and Th17-/Th2-like Tfh subsets in HCC and HC. Red lines in (B), (D) and (E) show the median values.

