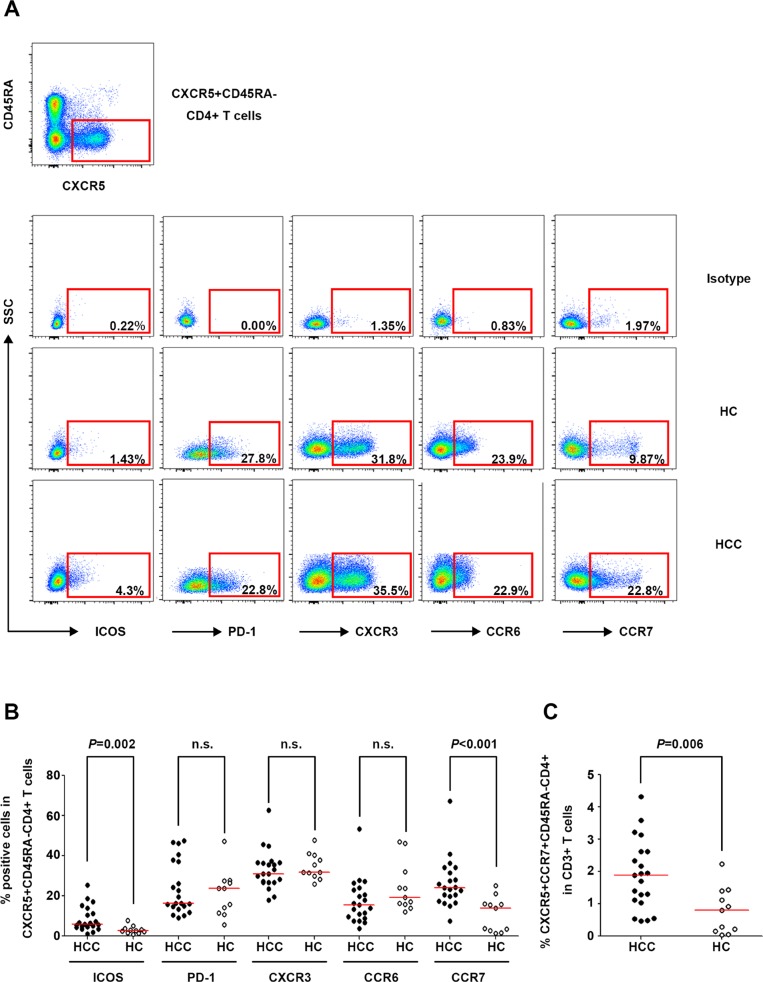
Figure 2. Phenotypic marker expression on circulating CXCR5+CD45RA−CD4+ T cells in HCC and HC.
(A) Expression of the phenotypic markers ICOS, PD-1, CXCR3, CCR6, and CCR7 on circulating Tfh cells in the isotype control (upper panel), a representative HCC patient (middle panel), and a representative HC (lower panel). (B) Percentages of ICOS+, PD-1+, CXCR3+, CCR6+, and CCR7+ cells among circulating CXCR5+CD45RA−CD4+ T cells in HCC (n = 21) and HC (n = 11). (C) Frequencies of circulating CXCR5+CCR7+CD45RA−CD4+ cells in HCC and HC. Red lines in (B) and (C) show the median values.

