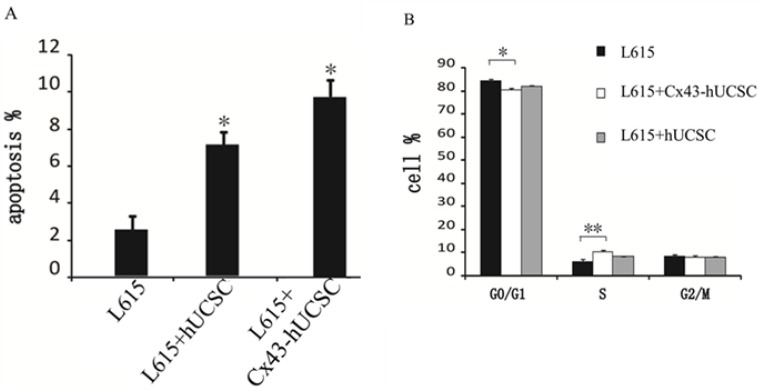
Figure 3. Cx43-hUCSC induces apoptosis and alters cell cycle profile.
L615 cells were cultured to 80% confluence and either by itself or co-cultured with hUCSC or with Cx43-hUCSC cells for three hours. (A) Apoptosis is quantified by fluorescent detection of FITC-labeled anti annexin V antibodies (N = 5) with FACS. (B) Annexin V negative L615 cells were sorted by flow cytometry and the cell cycle distribution (G0/G1, S and G2 + M phase) was quantified by Cell Cycle Assay Kit (Abcam, USA) and analyzed by Cell Fit 2.0 and 2.1 software. *indicates p < 0.05, **indicates p < 0.01.

