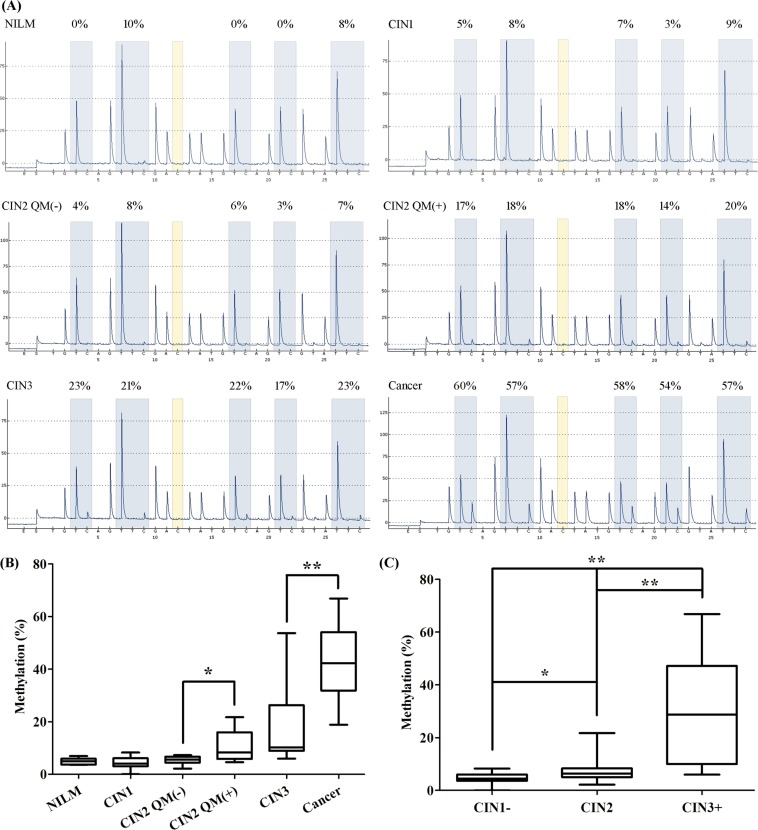
Figure 5. Pyrosequencing analysis of representative loci in JAM3-M4.
(A) Methylation status of representive loci in representative samples from patient groups: negative for intraepithelial lesion and malignancy (NILM), cervical intraepithelial neoplasia 1 (CIN1), CIN2 QMSP-negative [QM(−)], CIN2 QM(+), CIN3, and cancer confirmed by pyrosequencing. (B) Box-plot of the methylation percentage for JAM3-M4 for loci for the 6 groups, with statistical analysis between every 2 neighbouring groups. (C) Box-plot of the methylation percentage for JAM3-M4 for loci for diagnostic groups (CIN1−, CIN2, CIN3+) consistent with the QMSP analysis. Horizontal line is median, whiskers are 5th and 95th percentiles, and lower and upper box boundaries are 25th and 75th percentiles. *P < 0.05, **P < 0.01.

