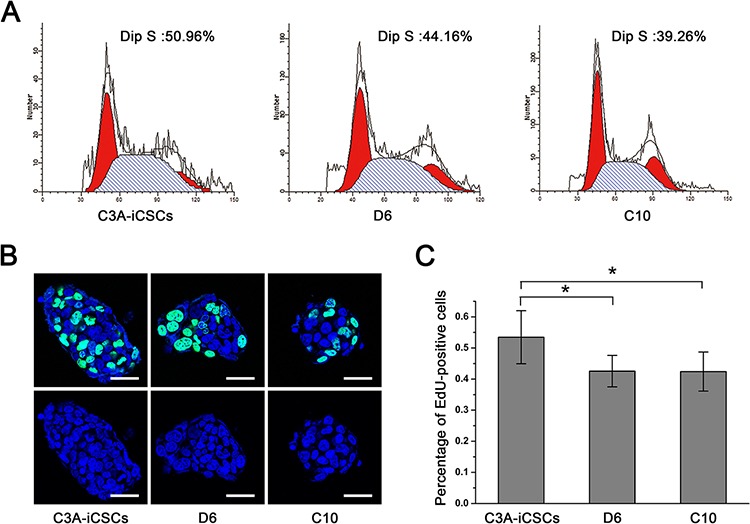
Figure 6. CD44− C3A-iCSCs got lower proliferation.

A. Flow cytometric analysis of the cell cycle of C3A-iCSCs, D6 and C10 cells. Numbers indicated the percentage of cells in S phase. B. Immunofluorescence staining of EdU positive cells of C3A-iCSCs, D6 and C10 cells. Green indicated positive staining. Nuclei were counterstained with Hoechst 33342 (blue). Scale bar, 40 μm. C. Histogram of percentage of EdU positive cells in C3A-iCSCs, D6 and C10 cells with standard deviations. P < 0.05, n = 6.
