
Figure 2. Immunohistochemical staining of CTGF on formalin-fixed tissue sections.
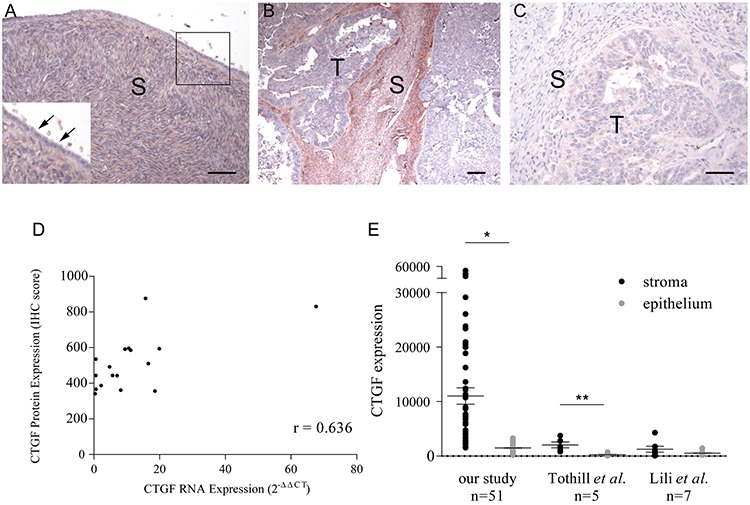
A. Normal ovary (inset shows higher magnification of boxed region). Arrows indicate an absence of CTGF expression in normal ovarian surface epithelium. B. HGSOC with high-levels of stromal CTGF expression. C. A negative control using normal rabbit IgG on a HGSOC with high-levels of stromal CTGF expression. S = stroma, T = tumor. Bar = 50 μm. D. Correlation between CTGF stromal expression by real-time PCR and by immunohistochemistry in 17 HGSOC tumors (Pearson's r = 0.636). E. CTGF expression in HGSOC stroma as measured by microarray in our study, and studies described by Tothill et al. [15] and Lili et al. [16]. *p-value < 10−5, **p-value < 0.02.