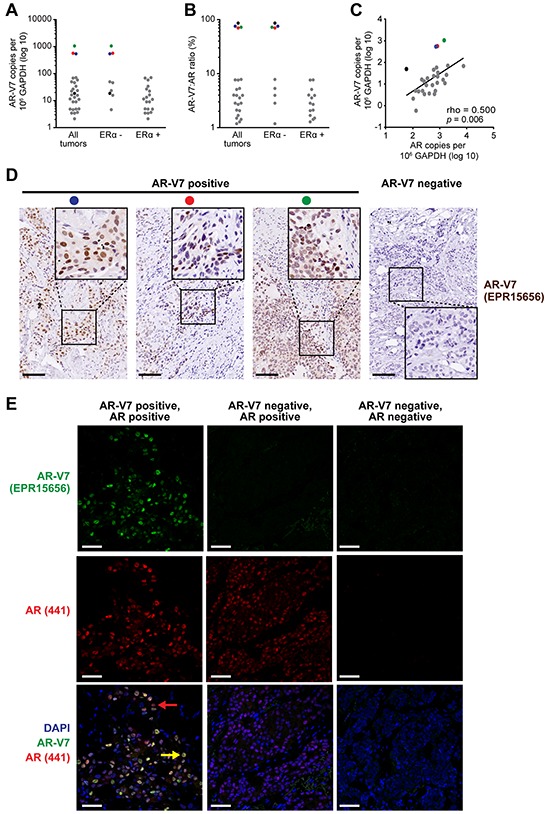
Figure 2. The AR variant AR-V7 is expressed in clinical breast cancer samples.

A. Expression of AR-V7 in ERα-positive (n = 35) and ERα-negative (n = 19) breast cancers, as determined by qRT-PCR. A Cq < 35 was used as a cut-off for determining AR-V7 positivity. AR-V7 copy number was calculated as described in Materials and Methods. B. Ratio of AR-V7 as a proportion of AR-FL (in AR-V7-positive tumors). C. Correlation between AR-V7 and AR-FL copy number in AR-V7-positive tumors. Pearson's correlation rho and p values are shown. Note that three tumors with high AR-V7 mRNA levels (red, blue green) or a high AR-V7:AR-FL ratio (black) are identifiable in (A)-(C) by color. D. Detection of AR-V7 protein by IHC in 3 breast tumors with high levels of AR-V7 mRNA expression (left). Positive staining was not detected in specimens that do not express AR-V7 mRNA (a representative is shown on the right). Inset images of higher magnification demonstrate strong nuclear staining. Colored dots enable matching of samples to (A)-(C) Scale bars are 100 microns. E. Detection of AR-V7 protein by IF and co-localization with AR-FL. Shown are an AR-V7 positive tumor (left), an AR-V7-negative but AR-positive tumor (middle), and a dual-negative tumor (right). Nuclei were stained with DAPI. In the bottom left image, a yellow arrow indicates a representative cell with strong AR-FL and AR-V7 staining and a red arrow indicates a representative cell with strong AR-FL staining but weak or no AR-V7 staining. Scale bars are 50 microns.
