
Figure 3. SMLM images of single cells reveal clustering of miR-31 molecules and differential extracellular distribution in low- and highly metastatic CRC cells.
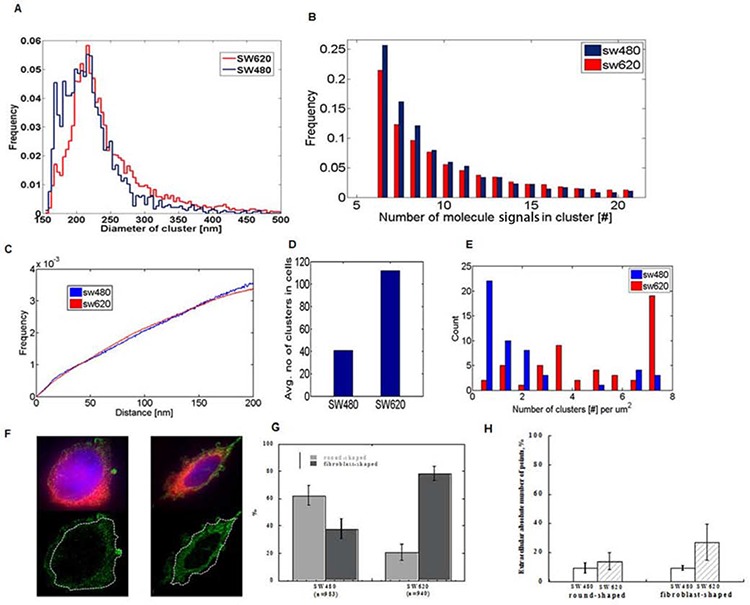
A. Line diagram showing the frequency distribution of observed cluster sizes in SW480 and SW620 cells. Both cell lines are characterized by the same cluster size. B. Frequency histogram of miR-31 molecules in individual clusters in the two cell line types showing a wide range in miR-molecule count. C. Frequency histogram of densities of miR-31 molecules within clusters in both SW480 and SW620 cells which are almost identical. D. Average cluster count in SW480 and SW620 cells showing a significantly higher tally in SW620 cells (40 in SW480 vs 110 in SW620 cells). E. Cluster density distribution of miR-31 molecules in SW480 and SW620 cells showing a higher number of clusters/μm2 cell surface area in SW620 cells. SW620 cells have a smaller surface area than SW480 cells (see text). F. Representative example of the subcellular distribution of miR-31 molecules in a cell; cytoplasm (blue), plasma membrane (red), and the SMLM reconstruction of miR-31 molecules are represented in green. The dashed white lines show plasma membrane boundaries. Scale bar 1 μm. G. Both cell lines are characterized by round and fibroblast shapes (SW480 predominantly round, SW620 predominantly fibroblast). SW620 cells were found to have a higher number of extra-cellular miRs in both sub-populations H. Relative quantities of extracellular miR-31 molecules in the round and fibroblast shaped sub-populations of SW480 and SW620 cells.