
Figure 4. Uveal tumor cells express VEGF-A and VEGFR-1.
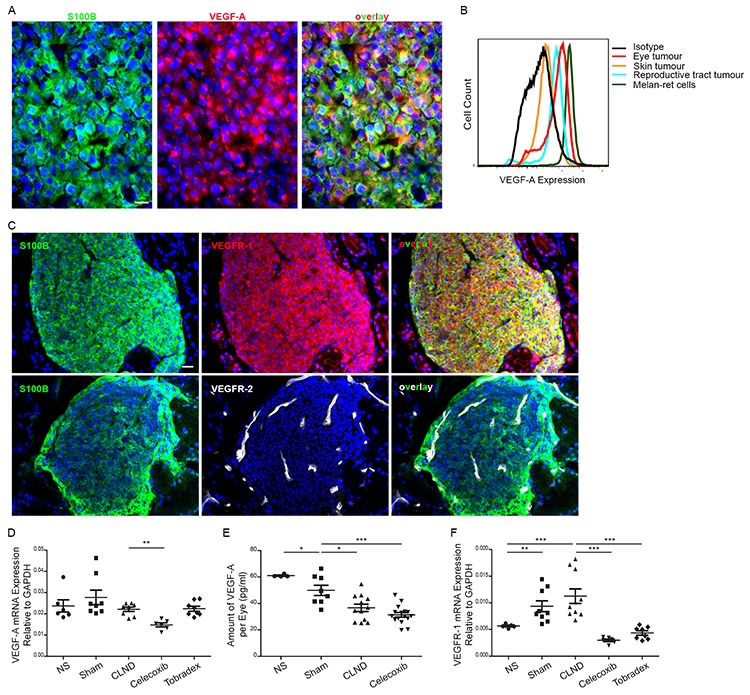
A. Eye tumors cross-sections were immunostained with anti-S100B (green) and anti-VEGF-A (red) antibodies. Scale bar = 10 um. B. Intracellular expression of VEGF-A in tumor cells from uveal (red), skin (orange) or reproductive tract tumors (blue), and Melan-ret cell line (green). Cells immunostained for CD45loCD31loPDGFRαloVEGF-A+ were evaluated by flow cytometry. C. Immunofluorescent staining for VEGFR-1 (top) or -R2 (bottom) in primary uveal tumor cross-sections. Scale bar = 20 um. D. Graph comparing the gene expression level of VEGF-A relative to GAPDH in primary uveal tumor from NS, sham, CLND, Celecoxib- and Tobradex-treated mice. Each point represents a tumor bearing eye (n = 3–8 mice). two-tailed Mann-Whitney; ** p value < 0.01. E. VEGF-A protein content in homogenates of NS, sham, CLND and Celecoxib-treated uveal tumors was examined by ELISA. Each point represents a tumor bearing eye (n = 5–16 mice). two-tailed Mann-Whitney; * p value < 0.05 and *** p value < 0.001. F. Quantitative RT-PCR analysis of VEGFR-1 in uveal tumors of NS, sham, CLND, Celecoxib- and Tobradex-treated mice. Each point represents a tumor-bearing eye (n = 3–8 mice). two-tailed Mann-Whitney; ** p value < 0.01 and *** p value < 0.001.