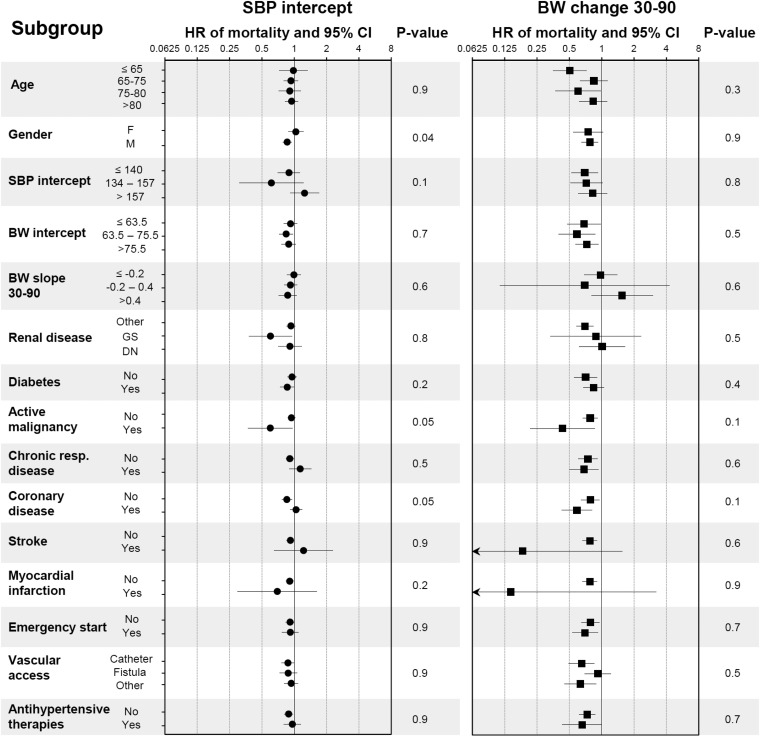
Fig. 3.
Effect on mortality of SBP and BW slope stratified by subgroup. Hazard ratio (HR) of mortality for a 10 mmHg higher SBP (left panel) and a 1 kg/month higher BW slope (right panel) estimated within each subgroup using the adjustment Model 1 (age, gender, venous access, emergency start, diabetes, active malignancy, chronic respiratory disease, coronary disease, cerebrovascular disease and myocardial infarction). Arrows represent confidence intervals (CI) larger than depicted on the graph. P-values for interactions are displayed.

