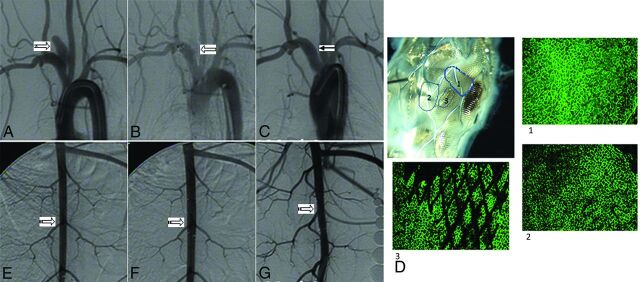
Fig 3.
A, Digital subtraction angiogram shows the aneurysm before treatment (notched right arrow). B, DSA image immediately after device deployment shows significant blood flow reduction in the aneurysm (left block arrow). C, DSA image at 4 weeks of deployment shows complete aneurysm occlusion (grade I) (left arrow). D, Gross pathology along with en face CD 31 immunofluorescent staining (original magnification water lens 20×) shows that 89% of the aneurysm neck area was covered by endothelialized tissue (areas 1, 2, and 3). E, DSA image shows the lumbar arteries before deployment in the abdominal aorta (striped right arrow). F, DSA image immediately after device deployment shows patent lumbar arteries (striped right arrow). G, DSA image at 4 weeks of deployment shows that the lumbar arteries remain patent (striped right arrow).

