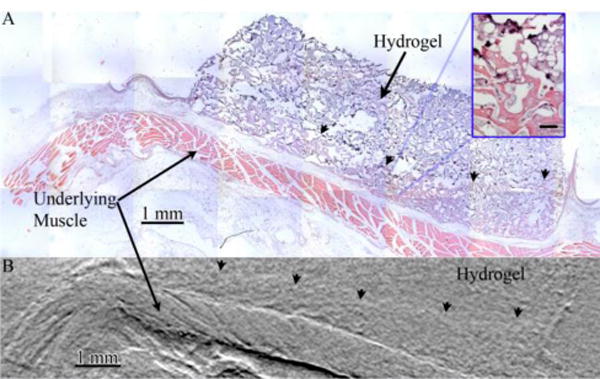
Figure 5.

Images of a hydrogel-tissue sample acquired via A) sectioning of the sample followed by H&E staining and widefield optical microscopy and B) digital slices of an XPC refraction CT of whole sample volumes Structure in the underlying muscle is visible in both images as is the front of invading fibrovascular tissue (arrowheads). Inset displayed magnified view of hydrogel (dark purple) and invading fibrovascular tissue Scalebar in inset is 100 μm.
