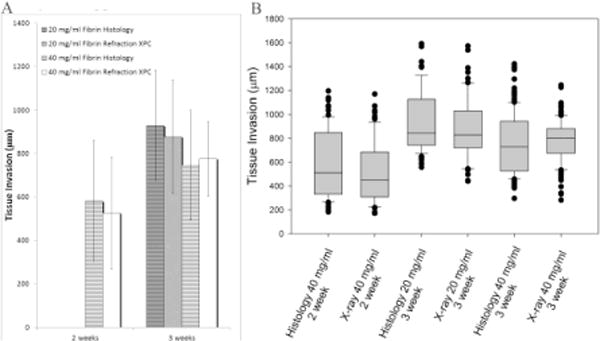
Figure 6.

A) Bar graph displaying the mean and standard deviation of tissue invasion depth measured from both histology (striped) and XPC (solid) images B) Box plot displaying median tissue invasion depth along with 10th, 25th, 75th, and 90th percentiles as vertical boxes with error bars for both histology and XPC images XPC provides similar results to the gold standard histological techniques with more precise measurement and less variations.
