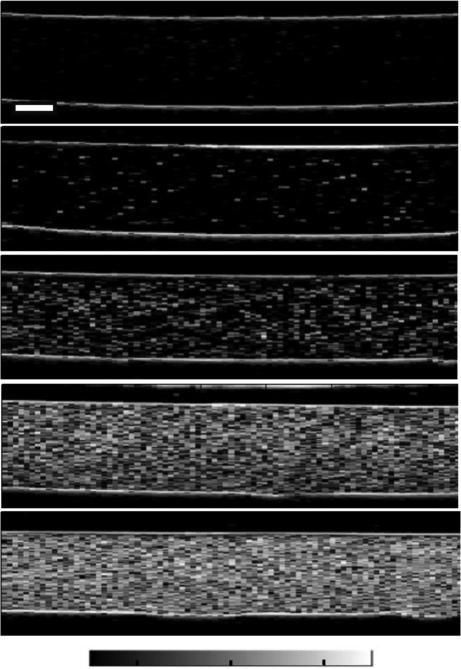
Figure 2. B-scan images of cell-embedded agarose gels.
Representative agarose gels with cell concentrations of (A) 0, (B) 1×10⁴, (C) 1×10⁵, (D) 5×10⁵, (E) 1×10⁶ cell/mL. Data were acquired using a 38-MHz transducer. Scale bar, 1 mm. With kind permission from Springer Science+Business Media: Annals of Biomedical Engineering, Estimating Cell Concentration in Three-Dimensional Engineered Tissues Using High Frequency Quantitative Ultrasound, 42, 2014, 1292, Mercado, K.P., Helguera, M., Hocking, D.C., Dalecki, D. Figure 4.

