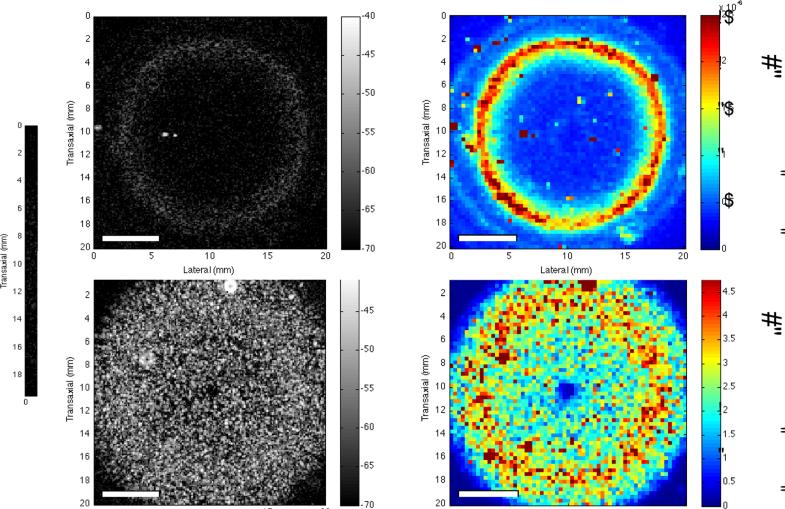
Figure 3. C-scan and IBC parametric imaging of collagen gels.
Collagen (2 mg/mL) gels were fabricated in 12-well tissue culture plates in the absence (A, B) and presence (C, D) of cells. Gels were polymerized for 1 h at 37 °C. The gels were 9 mm thick and 22 mm in diameter. C-scan images of the (A) acellular and (C) cell-embedded gels are shown. The ultrasound transducer was focused at the middle of each gel (axial depth of 4.5 mm). Each pixel in the IBC images (B, D) corresponds to a 3-D ROI with 9 RF lines (3 RF lines laterally, 3 RF lines transaxially) of 1-mm axial length. Scale bar, 5 mm. Note the colorbar scale in the IBC image of cell-embedded gels (D) is an order of magnitude greater than that of acellular gels (B). Reprinted from: Tissue Engineering, Part C, Noninvasive Quantitative Imaging of Collagen Microstructure in Three-Dimensional Hydrogels Using High-Frequency Ultrasound, 21, 2015, 671, Mercado, K.P., Helguera, M., Hocking, D.C., Dalecki, D. Figure 8.

