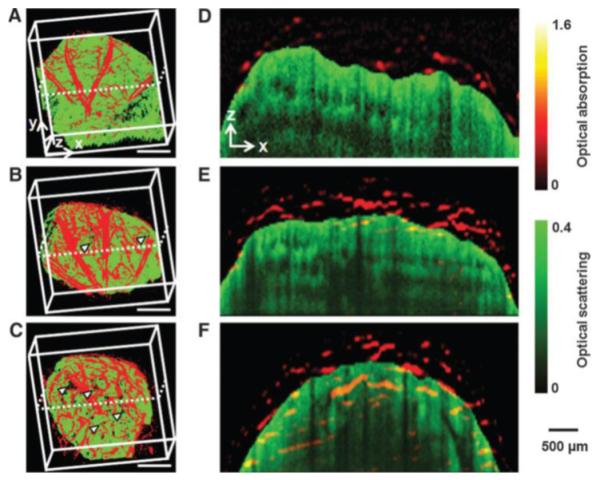
Figure 10.

Optical resolution photoacoustic microscopy (OR-PAM) and optical coherence tomography (OCT) co-registered images showing the development of neovasculature (red) and scaffold/tissue construct (green) at 2 (A), 4(B), and 6(C) weeks after implantation of Poly(d, l-lactide-co-glycolide) (PLGA) inverse opal scaffold in the nude mouse ear. Arrowheads indicate the growth of neovasculature into the scaffold pores (scale bars: 500 mm). (D–F) Co-registered B-scan images at the planes indicated by dotted lines in (a–d), respectively, showing the blood vessel growth into the inner scaffold pores. Adapted from Fig. 3.8
