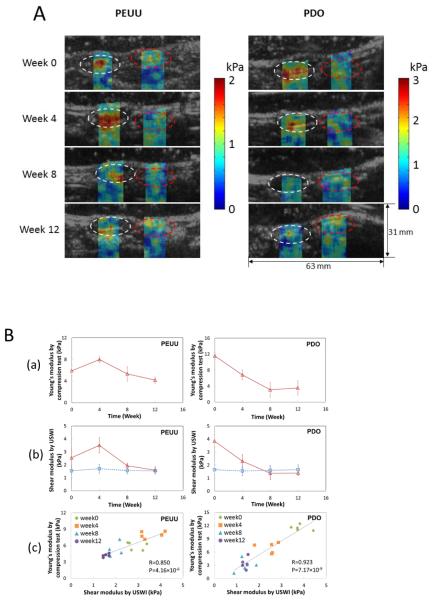
Fig. 5.
Panel A: Shear modulus maps reconstructed using USWEI for two types of polymeric scaffolds (PEUU and PDO) that were implanted in the rat abdominal wall and overlaid B-mode images over implantation period. White and red dashed circles denote the engineered tissue construct and surrounding native tissue, respectively. Panel B: Elastic modulus obtained by USWEI compared with direct compression measurements. Panel B: (a) Young's modulus obtained by compression tests using a commercial testing machine. (b) Average shear modulus of the constructs (red open triangle) and native tissue (blue open square) obtained by USWEI over implantation period. (c) Scatter plots presents the relation between the Young's modulus and shear modulus from the same samples for corresponding implantation time periods. R denotes the correlation coefficient and P represents the p-value for the correlation between the Young's modulus (a) and shear modulus (b). Adapted from Figures 3 & 4.63

