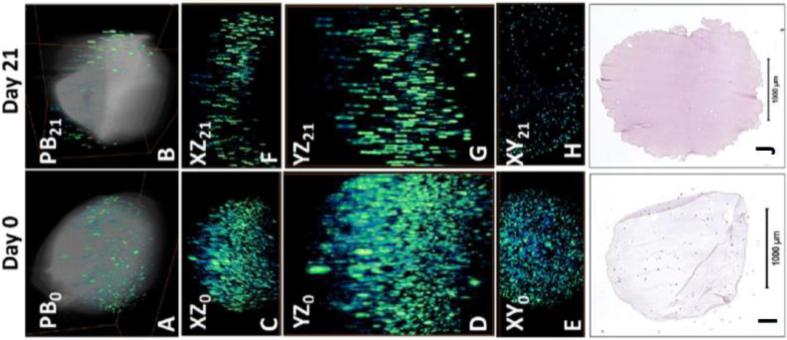
FIGURE 5.
(a-b) 3D FLOT tomograms of fluorescent-labeled hMSCs (green-blue color scale) in alginate scaffolds (grey color scale) at day 0 and 21, respectively. (c-h) Projection view of FLOT. XZ, YZ, and XY are the tomographic projections of an alginate sample on day 0 and 21. FOV: 4.6 × 1.6 × 2.56 mm3 (day 0) and 4.6 × 2.3 × 3.7 mm3 (day 21). (i-j) H&E staining of histology sections. Cells are stained dark pink and the alginate is stained purple/pink.

