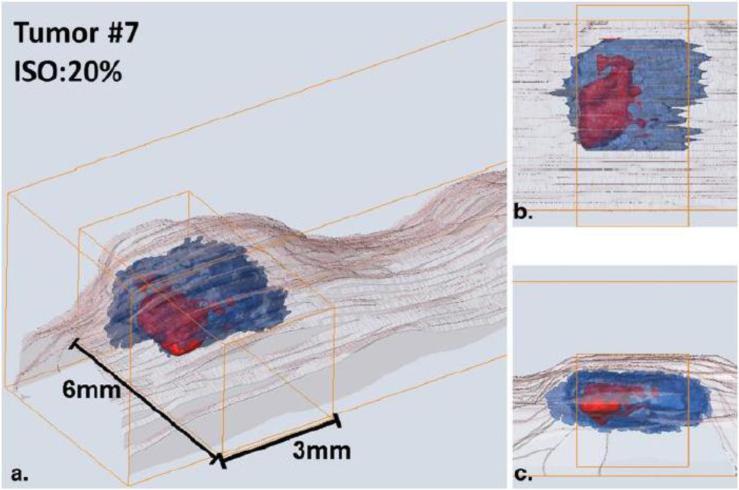
FIGURE 7.
A 3D image of a skin tumor model (basal cell carcinoma). (a) Ultrasound (US, blue) and MFMT (red) reconstructions delineate the tumor area and agent bio-distribution area. US data also gave tail structure (pink). MFMT data was acquired using the photodynamic therapy agent (HPPH)'s fluorescent signals. (b) Top view and (c) depth view of the co-registered tumor images. The results indicate a strong heterogeneity between the tumor margin and agent bio-distribution. Adapted from Ref. 39 with permission.

