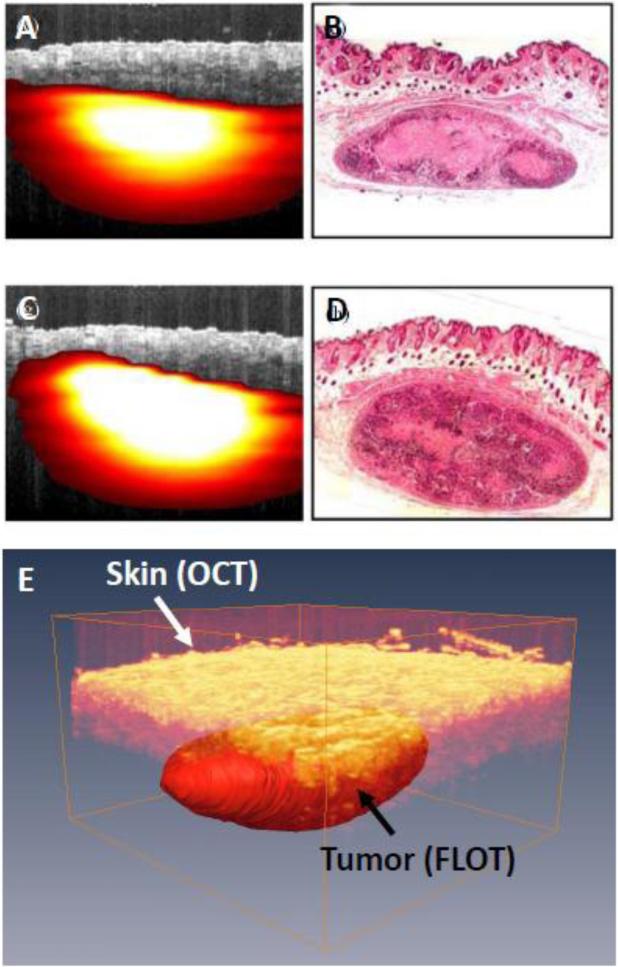
FIGURE 8.
(a) Fused OCT-FLOT image of subcutaneous human breast tumor xenograft in a mouse model in vivo (breast cancer cells MDA-MB-231 labeled with tdTomato red fluorescence protein) and (b) Corresponding histology. (c) and (d) are OCT-FLOT image and corresponding histology of another cross-section of the same tumor. Image size: 2.2 mm (depth) × 2.8 mm (lateral). (e) 3D co-registered OCT and FLOT image. (a-d) are adapted from Ref. 34 with permission.

