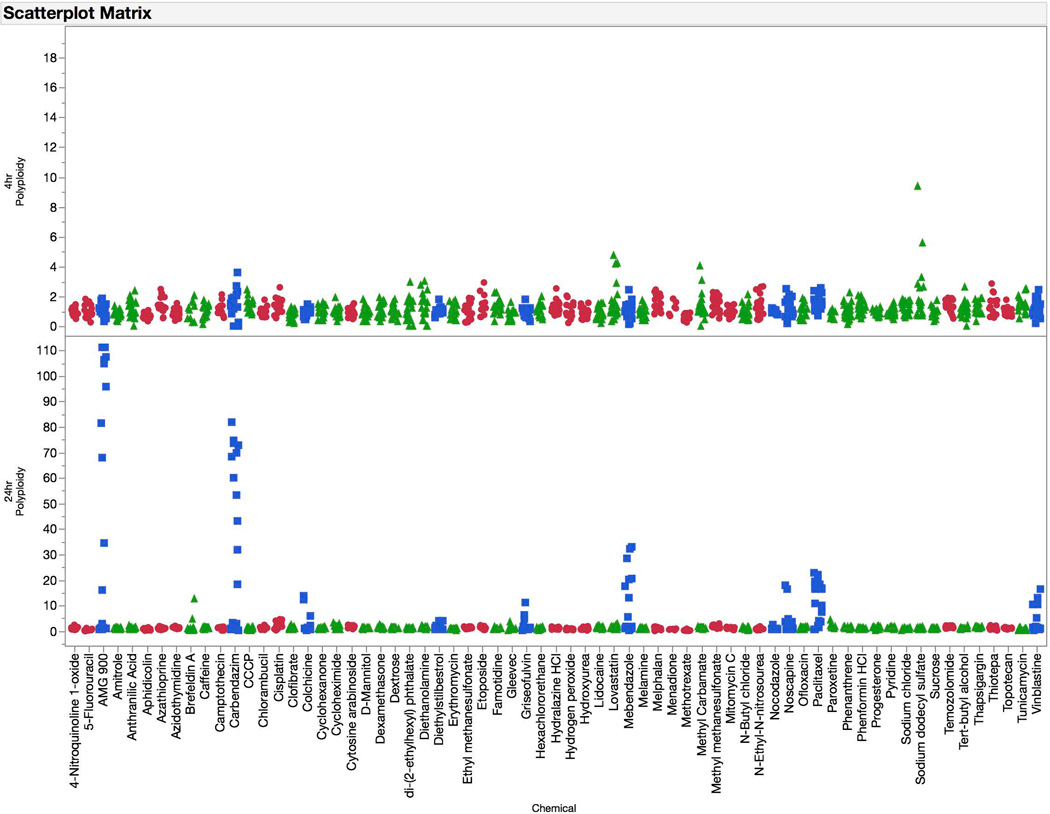
Figure 7.
Fold-increases in polyploid cells are graphed for each of 67 training set chemicals for both the 4 hr (top panel) and 24 hr (bottom panel) time points. Chemicals are coded according to genotoxic MoA: clastogens = red circles, aneugens = blue squares, and non-genotoxicants = green triangles. A series of data points are plotted for each chemical, as each represents a different concentration. These data highlight the sensitivity of polyploidization to aneugenic activity at the 24 hr time point.

