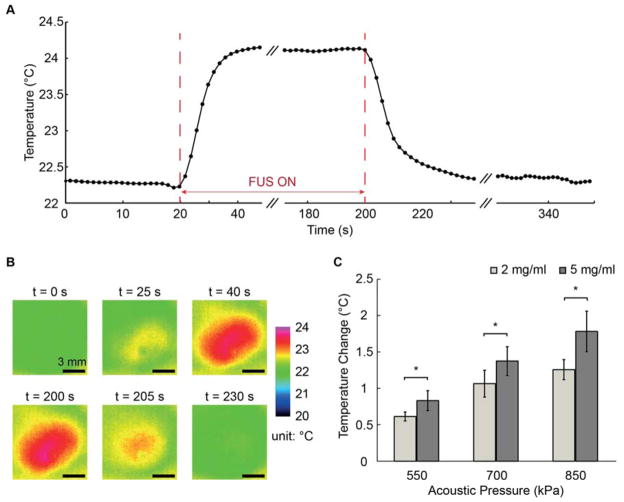
Figure 4.
(A) Example temperature-time curve of a 5.0 mg/mL HA-doped collagen hydrogel when tested at 850 kPa acoustic pressure. (B) Example of temperature maps at selected time points during creep testing. (C) Aggregate temperature increase data (n=4) for 2.0 mg/mL and 5.0 mg/mL HA-collagen constructs under acoustic pressure of 550, 700, and 850 kPa with 180 s FUS pulse duration. Best viewed in color.

