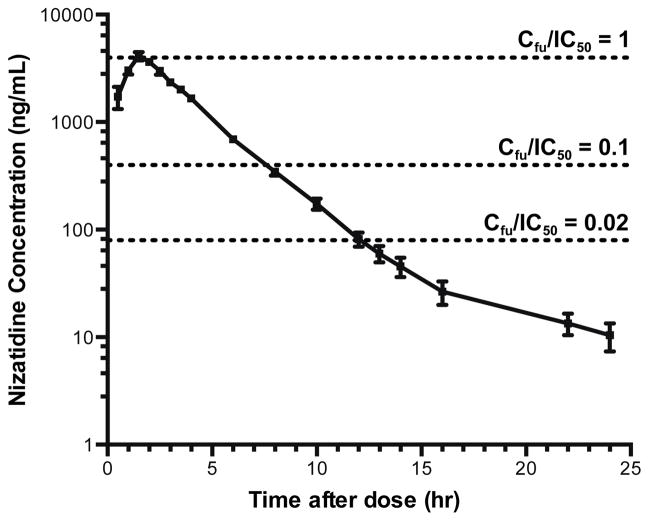
Figure 2. Mean nizatidine plasma concentrations following administration of a single oral dose to 12 healthy volunteers.
Nizatidine plasma concentrations were determined after a 600 mg single oral dose in combination with metformin. The dotted horizontal lines are drawn at Cfu/IC50 ratios of 1, 0.1 (FDA cut-off) and 0.02 (EMA cut-off). Data represent mean ± SEM.
Cfu, unbound concentration in plasma; IC50, concentration at half the maximum inhibition of active transport; FDA, Food and Drug Administration; EMA, European Medicines Agency

