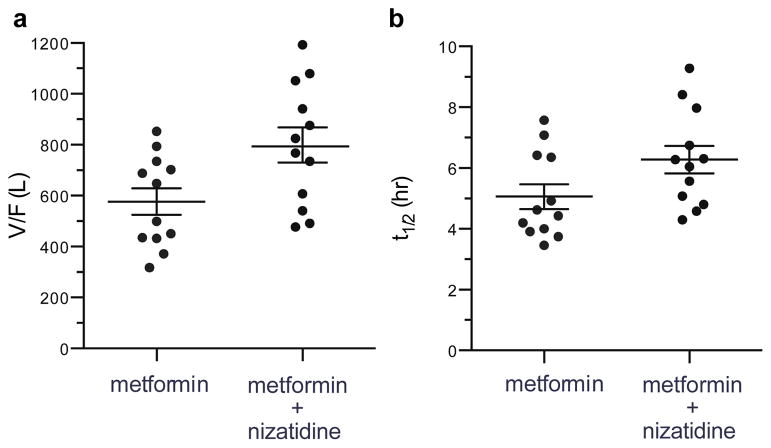
Figure 4. Volume of distribution (a) and half-life (b) alterations between treatment groups.
Symbols, horizontal line and brackets represent individual data points, mean value of all subjects and standard error of the mean, respectively.
V/F, apparent volume of distribution; t1/2, plasma terminal elimination half-life.

