Figure 2.
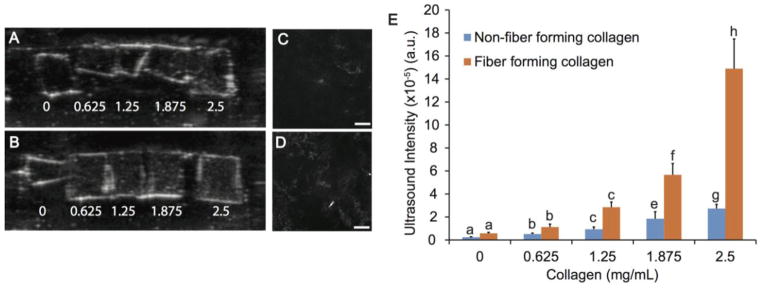
Ultrasound imaging of PEG gels with various concentrations of collagen. Both non-fiber forming (A) and fiber forming (B) collagen was added in concentrations ranging from 0 to 2.5 mg/mL. The borders of each gel appear white due to the gel-water interface. There is a visible gradient for fiber-forming collagen, which correlates well to the quantitative intensity values. Collagen fibers were observed in confocal reflectance microscopy images of (C) 1.875 and (D) 2.5 mg/mL fiber forming collagen in PEG gels at 10x. No reflection was found in PEG gels with non-fiber forming collagen at any concentration. Scale bar = 200 μm. (E) Ultrasound signal intensity from B-mode images of PEG gels with 0–2.5 mg/mL non-fiber forming or fiber forming collagen. Statistical groups are indicated by lowercase letters with each letter indicating groups that are statistically similar. A significant increase in intensity for 1.875 and 2.5 mg/mL fiber forming collagen as compared to non-fiber forming collagen at each concentration (p<0.05).

