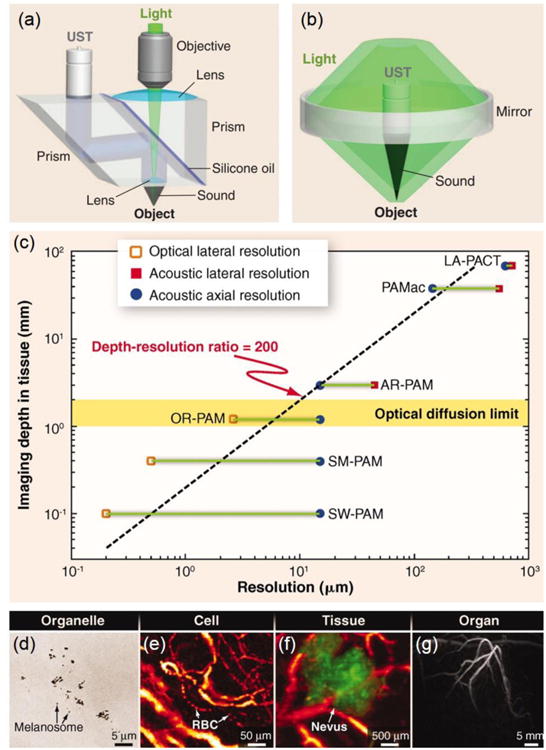
Figure 1.

(a, b) Schematic illustrations of (a) OR-PAM and (b) AR-PAM, respectively. (c) Imaging depth versus spatial resolution for PAM. SM, submicrometer; LA, linear array. (d–g) Multi-scale PAM images of organelles, cells, tissues, and organs in vivo: (d) subwavelength PAM of melanosomes in the ear of a black mouse; (e) OR-PAM of individual red blood cells traveling along a capillary in a mouse ear; (f) AR-PAM of a nevus on a human forearm; and (g) PACT of vasculature in a human breast. Adapted with permission from Ref.20, copyright 2012 American Association for the Advancement of Science.
