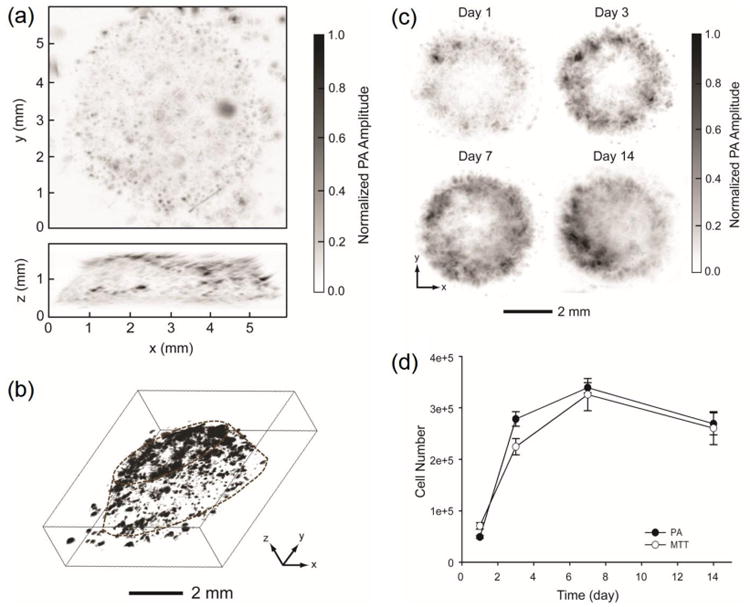
Figure 2.

(a) PAM coronal (top) and sagittal (side) MAP images. The black dots or patches correspond to melanoma cells. (b) A 3D reconstruction image, where the contour of the scaffold is marked by dotted lines. (c) Time course PAM images (coronal MAP of the entire volume) of melanoma cells in a typical PLGA inverse opal scaffold at 1, 3, 7, and 14 days post-seeding. (d) Quantitative analysis of melanoma cells in scaffolds derived from both the PAM volumetric data and the MTT assay. Adapted with permission from Ref.43, copyright 2010 Elsevier.
